

ITC, a leading FMCG company, announced an interim dividend of ₹6.25 per share for the fiscal year 2023-24. The record date for determining eligible shareholders for this dividend is set for February 8.
The dividend will be disbursed to eligible shareholders between February 26 and February 28. ITC stated in its stock exchange filing, “The Board declared an Interim Dividend of ₹6.25 per ordinary share of Rs 1 each for the financial year ending on 31st March 2024. Such Dividend will be paid between Monday, 26th February 2024 and Wednesday, 28th February 2024 to those Members entitled thereto. The board has fixed Thursday, 8th February 2024 as the Record Date to determine entitlement of the Members for such Interim Dividend.”
Stellar Q3 Financial Performance
ITC Ltd reported a standalone net profit of Rs 5,572 crore for the December quarter of FY24, marking an impressive 11 percent growth from the previous fiscal year. Sequentially, the net profit rose 13 percent from the preceding quarter. Consolidated net profit also saw a 6.5 percent increase, reaching Rs 5400.51 crore for the quarter ending in December.
Revenue Growth and EBITDA Margins
Total revenue from operations rose by 2 percent year-on-year to Rs 17,651.85 crore, with consolidated revenue increasing by 2.4 percent to Rs 19,484.50 crore. However, EBIDTA for the quarter decreased by 3.2 percent to Rs 6,024 crore, with an EBIDTA margin of 36.6 percent, down by 180 basis points year-on-year.
Segment-Wise Performance
The cigarettes segment witnessed a 3 percent YoY increase in revenue to ₹8,295 crore, while the other businesses segment exhibited robust performance with a revenue of ₹5,218 crore, reflecting an 8 percent growth compared to the year-ago period.
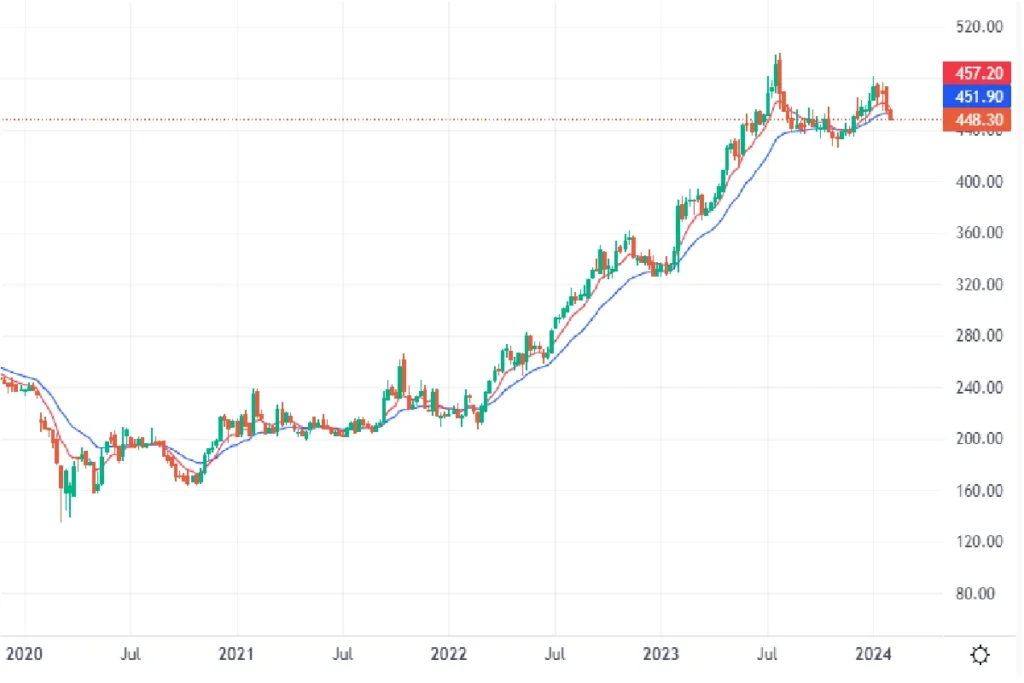
Weekly Chart of ITC Share
The stock’s weekly chart depicts a significant uptrend, trading above ₹450 per share, showcasing over 100 percent growth in just two years from ₹218 per share in January 2022.
DON'T MISS
While DIIs have remained consistent, FIIs have shown a slight increase in this quarter.
With impressive financial results and a bullish stock performance, investing in ITC shares appears appealing. However, it’s advisable to consult a financial advisor before making any investment decisions.
Disclaimer: (This information is provided solely for informational purposes. It is important to note that investing in the market or a business idea involves market risks. Before investing money as an investor/ owner/ partner, always consult an expert. DNP News Network Private Limited never advises to invest money on stocks or any specific business idea. We will not be liable for any financial losses.)
Keep watching our YouTube Channel ‘DNP INDIA’. Also, please subscribe and follow us on FACEBOOK, INSTAGRAM, and TWITTER.